Hint mode is switched on Switch off

CRB Index

daily
Index Points
UTC+3
Previous value
346.1001 Index Points on 13/06/2024
from
to
ADD-IN
Cbonds add-in
API
bond data api
Data for this index is not available for download
Authorization required
You need to request access

explore the most comprehensive database

800 000

bonds globally

Over 400

pricing sources

80 000

stocks

9 000

ETF

track your portfolio in the most efficient way

  • Bond Search
  • Watchlist
  • Excel ADD-IN
×

— Are you looking for the complete & verified bond data?

— We have everything you need:
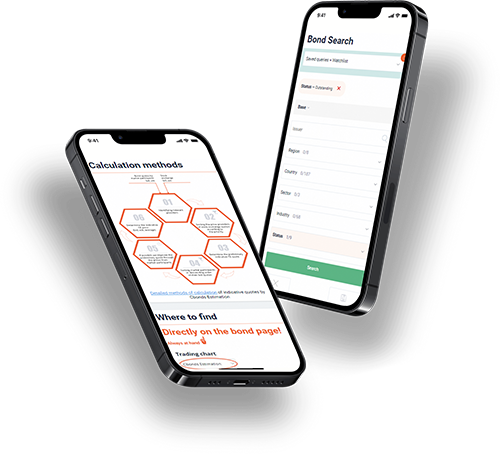
full data on over 700 000 bonds, stocks & ETFs; powerful bond screener; over 350 pricing sources among stock exchanges & OTC market; ratings & financial reports; user-friendly interface; available anywhere via Website, Excel Add-in and Mobile app.

Register
×

Why

You will have detailed descriptive & pricing data for 650K bonds, 76K stocks, 8K ETFs
Get full access to the platform from any device & via Cbonds app
Enhance your portfolio management with Cbonds Excel Add-in
Build yield maps, make chart comparison within a click
Don't wait any longer — start using Cbonds today! Register

Quotes by Market Participants

Index description

The CRB Index is a commodity index calculated based on the prices of commodity futures. Initially, the index was calculated by the Commodity Research Bureau, therefore it is called CRB. Later, Refinitiv became a provider of the index. The index consists of 19 components, grouped into 4 groups of liquidity: 1) Petroleum products, 2) seven highly liquid commodity assets 3) four liquid commodity assets 4) five commodity assets. The index Components are: aluminum, cocoa, coffee, copper, corn, cotton, crude oil, gold, fuel oil, pork, livestock, natural gas, nickel, orange juice, gasoline, silver, soybeans, sugar and wheat. The composition of index components can change and depends on factors: trading activity and spreads, the significance of a product (in terms of consumption and production), correlation and relationship with other assets, the property of a product as a commodity asset (for example, inflation protection), etc. This index is often the benchmark for many commodity ETFs.

List of securities for index calculation

The composition of the index list

The data is available via upload

Subgroup indices

Index Current value Date
Baltic Dry 1,948 Index Points 14/06/2024
Barley Index FOB Black Sea region and Caspian Sea 167.4 USD/T 14/06/2024
Bloomberg Agriculture Subindex 59.47 USD 14/06/2024
Bloomberg Commodity (BCOM) 102.44 Index Points 14/06/2024
Bloomberg Industrial Metals (BCOMIN) 151 Index Points 14/06/2024
CRB Index 344.28 Index Points 14/06/2024
China: Shanghai Shipping Exchange China (Export) Containerized Freight Index 1,733.47 Points 14/06/2024
Corn Index FOB Black Sea region and Caspian Sea 174.3 USD/T 14/06/2024
Daily OTC Sugar Index in the Volga Federal District 61,922 RUB/ton 14/06/2024
Daily OTC Sugar Index in tne Central Federal District 61,577 RUB/ton 14/06/2024
LME Index 4,180.4 Index Points 14/06/2024
MOEX Refined Gold Index 6,565.86 RUB per gram 14/06/2024
OTC Sugar Index NAMEX 61,961 RUB/ton 09/06/2024
S&P GSCI 575.087 Index Points 14/06/2024
Shanghai Containerized Freight Index 3,379.22 Points 14/06/2024
Soybean Index NAMEX 47,000 RUB/ton 14/06/2024
Sugar OTC Index Southern Federal District 62,013 RUB/ton 14/06/2024
Sunflower Meal NAMEX Export Index 212.93 USD/T 14/06/2024
Sunflower Oil NAMEX Export Index 809.89 USD/T 14/06/2024
Wheat Index FOB Black Sea region 235.7 USD/T 14/06/2024
Wheat Index NAMEX 17,695 RUB/ton 14/06/2024
World Container Index 4,716 USD 06/06/2024
Registration is required to get access.