


EBITDA (abbr. Earnings before interest, taxes, depreciation and amortization) is an analytical indicator showing the amount of profit before interest on loans, income tax and depreciation of assets.
The indicator is useful in comparison of enterprises of the same industry, but with different capital structures, it allows them to determine the efficiency of a company regardless of its debt to various creditors and the state, as well as on the depreciation method.
Despite its widespread use, this indicator is not a standardized accounting indicator; this is due to the vagueness of the concepts of "depreciation" and "interest" in accounting. The company’s management calculates EBITDA separately from standardized reporting and uses it to illustrate the company’s financial position.
There are several methods for calculating EBITDA:
1. “Top-down” method.
EBITDA = Operating profit + Amortization of fixed assets + Amortization of intangible assets
In this case it is assumed that operating income is the main source of income for the firm. The difference between EBITDA and operating income is only in the accrued depreciation.
2. “Bottom-up” method
EBITDA = Net Income + Interest Expenses + Corporate Income Taxes + Depreciation of Fixed and Intangible Assets
When using this method, EBITDA can get a lot of one-time items of accountability that will lead to a distortion of the results. Accurate data cannot be obtained without adjusting this formula.
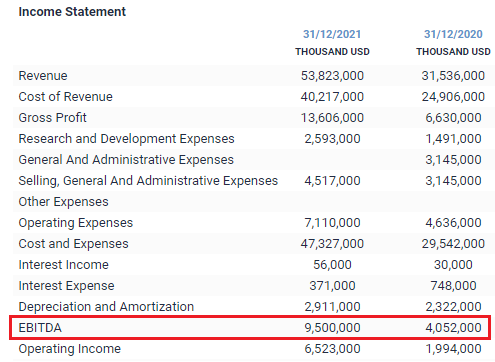
Using the example of Tesla reports, you can see that in 2021 EBITDA was USD 9.5 billion, up 134.45% year-on-year.

Everything you need for fixed income research and monitoring.