






Hint mode is switched on Switch off

ZPR - BMO Laddered Preferred Share Index ETF (CAD) (CA05581T1021)

The comparsion limit has been reached: only 5 tools has been added. To add a new one, please remove one of the existing tools.

FIND, SAVE & TRACK INVESTMENTS WITH CBONDS WATCHLIST

With Cbonds Watchlist you can always stay updated on your investments to make conscious decisions!

Watchlist
You need to request access
Cbonds API
Bring Market Data into Your Systems

Access ETF and Mutual Funds Data via API

  • Prices & NAV
  • Fund Structure
  • Inflows & dividends
 
(%)
CA05581T1021
ZPR ISIN
Exchange Traded Funds (ETF)
Type of fund
BMO Global Asset Management
Provider
12.79 CAD
NAV per Share | 26/10/2026
14/11/2012
Inception Date
12 times per year
Dividend payments
CEOIXX
CFI
ZPR
Ticker
Formed
Status
Equity
Investment category
Preferred Stock
Sector
Canada
Investor locations
Solactive Laddered Canadian Preferred Share Index
Benchmark
0.5 %
Total Cost Ratio
1,624.94 mln CAD
Fund NAV | 26/10/2026
1,624.94 mln CAD
Share Class NAV | 26/10/2026
No
UCITS
Canada
Country of registration

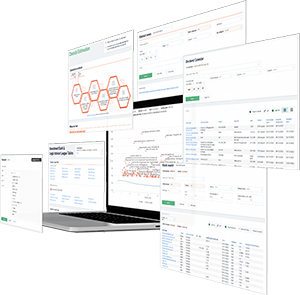
Try in 7-days Trial access

  • Get full online access to the database
  • Use our powerful bond screener
  • Track bond prices from 400+ sources
  • Smart Portfolio Monitoring

Yield on 29/10/2026, Toronto SE

  • YTD
    8.25 %
  • 1M
    0.39 %
  • 3M
    -1.13 %
  • 6M
    3.43 %
  • 1Y
    11.33 %
  • 3Y
    83.11 %
  • 5Y
    33.17 %
  • 10Y
    52.68 %
At the price on the exchange, taking into account income payments

Latest data on
Add to compare

Quotes (ZPR)

Explore the most comprehensive database

1 000 000

bonds

100 000

stocks

175 910

ETF & Funds

100 000

indices

Track your portfolio in the most efficient way

  • Bond Search
  • Watchlist
  • Excel ADD-IN
×

— Are you looking for the complete & verified bond data?

— We have everything you need:

full data on over 1 000 000 bonds, 100 000 stocks, 100 000 indices, 17 000 ETF and 150 000 Mutual Funds; powerful bond screener; over 350 pricing sources among stock exchanges & OTC market; ratings & financial reports; user-friendly interface; available anywhere via Website, Excel Add-in and Mobile app.

Register
×

Why

You will have detailed descriptive & pricing data for 1M bonds, 100K stocks, 100K indices, 17K ETF and 150K Mutual Funds
Get full access to the platform from any device & via Cbonds app
Enhance your portfolio management with Cbonds Excel Add-in
Build yield maps, make chart comparison within a click
Don't wait any longer — start using Cbonds today! Register

Price dynamics

Fund profile

The BMO Laddered Preferred Share Index ETF seeks to replicate the performance of the Solactive Laddered Canadian Preferred Share Index investing in Canadian preferred shares that meet size, liquidity, listing, and quality criteria. The Index uses a five-year laddered structure where annual buckets are equal-weighted while constituent securities within each bucket are market-capitalization-weighted.

ZPR profile

The BMO Laddered Preferred Share Index ETF (CAD) is a(n) Equity Exchange Traded Funds (ETF) seeks to invest in Preferred Stock sector located in Canada. The BMO Global Asset Management fund’s base currency is CAD and the share class was registered 14.11.2012 with unique ISIN - CA05581T1021. Main exchange is Toronto SE and ticker symbol is ZPR. The total expense ratio is 0.5%. The BMO Laddered Preferred Share Index ETF (CAD) pays dividends 12 time(s) per year.

Structure ZPR on 23/10/2026

Paper Value
BCE INC SR AK 3.306 PFD 2.45%
Enbridge Inc PREFERRE PFD 1.86%
NATIONAL SR 38 7.027 PFD 1.69%
TC ENERGY SR 5 1.949 PFD 1.63%
BROOKFIEL SR 42 3.254 PFD 1.62%
BCE INC PREFERRED STO PFD 1.61%
Fortis Inc SR M 3.913 PFD 1.51%
TC ENERGY SR 7 5.985 PFD 1.48%
POWER FINA SR P 1.998 PFD 1.46%
TORONTO-D SR 16 6.301 PFD 1.43%
BROOKFIELD OFFICE PRO PFD 1.43%
Brookfield Corp PREFE PFD 1.41%
BROOKFIELD SR R 4.30 PFD 1.38%
TRANSALTA SR A 2.877 PFD 1.37%
ENBRIDGE I SR B 5.202 PFD 1.36%
MANULIFE FINANCIAL CO PFD 1.33%
BCE INC PREFERRED STO PFD 1.33%
CANADIAN UT SR Y 3.40 PFD 1.32%
TC ENERGY SR 3 1.694 PFD 1.31%
BCE INC SR AM 2.939 PFD 1.28%
ENBRIDGE SR 13 3.043 PFD 1.28%
TORONTO-DO SR 1 3.662 PFD 1.27%
CANADIAN SR 47 5.878 PFD 1.26%
Emera Inc PREFERRED S PFD 1.26%
BCE INC PREFERRED STO PFD 1.23%
GREAT-WEST SR N 1.749 PFD 1.2%
BROOKFIELD RENEW 5.75 PFD 1.2%
Emera Inc SR F 4.202 PFD 1.19%
BANK OF MO SR 44 4.85 PFD 1.16%
BROOKFIELD SR 48 4.75 PFD 1.15%
BROOKFIELD SR 46 4.80 PFD 1.13%
SUN LIFE FINANCIAL IN PFD 1.07%
BROOKFIEL SR EE 5.496 PFD 1.06%
BROOKFIEL SR 38 3.568 PFD 1.06%
Brookfield Corp PREFE PFD 1.06%
Enbridge Inc PREFERRE PFD 1.05%
ACTIONS PR SR 1 3.355 PFD 1.05%
MANULIFE F SR 9 5.978 PFD 1.04%
TC ENERGY SR 1 3.479 PFD 1.03%
PEMBINA PI SR 21 4.90 PFD 1.02%
BROOKFIELD SR P 4.536 PFD 1.01%
SUN LIFE SR 10R 2.967 PFD 1%
TC ENERGY SR 9 3.762 PFD 1%
ENBRIDGE SR 19 6.212 PFD 1%
TORONTO-D SR 18 5.747 PFD 0.98%
BROOKFIELD OFFICE PRO PFD 0.98%
FAIRFAX FI SR K 4.671 PFD 0.97%
ENBRIDGE I SR 3 3.737 PFD 0.97%
TRANSALTA SR C 5.854 PFD 0.96%
INTACT FIN SR 1 4.841 PFD 0.95%
BROOKFIEL SR 30 4.685 PFD 0.93%
NATIONAL SR 30 4.025 PFD 0.92%
MANULIFE F SR 17 3.80 PFD 0.9%
BROOKFIEL SR 26 3.846 PFD 0.89%
BROOKFIELD INFRASTRUC PFD 0.89%
TRANSALTA SR E 6.894 PFD 0.89%
MANULIFE F SR 3 2.348 PFD 0.88%
ROYAL BANK SR BO 4.80 PFD 0.88%
NATIONAL B SR 42 4.95 PFD 0.86%
NATIONAL B SR 40 4.60 PFD 0.85%
BCE INC PREFERRED STO PFD 0.85%
Emera Inc SR H 4.90 PFD 0.84%
ENBRIDGE I SR N 5.086 PFD 0.84%
BROOKFIELD SR II 4.85 PFD 0.83%
Emera Inc SR A 2.182 PFD 0.81%
Enbridge Inc PREFERRE PFD 0.8%
PEMBINA P SR 15 6.164 PFD 0.79%
ENBRIDGE I SR F 5.538 PFD 0.78%
BROOKFI SR 28-A 4.606 PFD 0.76%
ENBRIDGE I SR R 4.073 PFD 0.75%
BROOKFIEL SR 32 5.061 PFD 0.74%
ENBRIDGE I SR P 4.379 PFD 0.74%
Emera Inc SR C 4.721 PFD 0.71%
INTACT FINA SR 7 4.90 PFD 0.7%
MANULIFE F SR 25 4.70 PFD 0.69%
BROOKFIEL SR 40 4.029 PFD 0.69%
NORTHLAND P SR 1 3.20 PFD 0.68%
BROOKFIELD SR T 5.383 PFD 0.66%
BROOKFIELD SR AA 4.71 PFD 0.66%
ACTIONS PRIVILE 4.351 PFD 0.65%
PEMBINA P SR 25 6.481 PFD 0.65%
BCE INC PREFERRED STO PFD 0.64%
PEMBINA PI SR 1 6.525 PFD 0.63%
MANULIFE SR 13 4.414 PFD 0.62%
BROOKFIEL SR 11* 5.10 PFD 0.62%
PEMBINA PI SR 5 4.573 PFD 0.61%
Fortis Inc PREFERRED PFD 0.61%
BROOKFIELD RENEWABLE PARTNERS LP 0.61%
PEMBINA PI SR 7 5.953 PFD 0.6%
BROOKFIEL SR 34 4.437 PFD 0.59%
Fortis Inc SR K 3.925 PFD 0.58%
ALTAGAS LT SR G 4.242 PFD 0.52%
ENBRIDGE I SR H 4.376 PFD 0.51%
BROOKFIELD SR 9 6.642 PFD 0.49%
Enbridge Inc PREFERRE PFD 0.47%
ENBRIDGE I SR 9 4.097 PFD 0.47%
TRANSALTA SR G 4.988 PFD 0.46%
PEMBINA PI SR 3 6.019 PFD 0.35%
PEMBINA P SR 17 4.821 PFD 0.35%
Other - %
Welcome to Cbonds
New to Cbonds? · Take a 90-second tour of the platform.

Discover what you can do with Cbonds

Everything you need for fixed income research and monitoring.

  • 00:23 Coverage
  • 00:40 Bond screener
  • 00:54 Parameters
  • 01:10 Watchlist, Mobile app
  • 01:15 Excel Add-in

Get access to the largest financial database

Try in 7-days Demo access

Free for company representative

  • Evaluate advanced analytical tools
  • Get full online access to the database
  • Try our powerful bond screener
  • Track bond prices from 400+ sources

Other ETF & Funds from this provider

Similar ETF & Funds

  • {{ item.etf.ttl }}
    {{ item.nav_usd }} mln
    NAV
    {{ item.expense_ratio }}
    Total Cost Ratio
Registration is required to get access.