










Explore the most comprehensive database
1 000 000
bonds
100 000
stocks
175 910
ETF & Funds
100 000
indices
Track your portfolio in the most efficient way

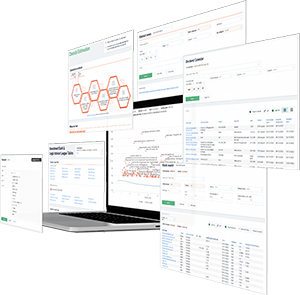
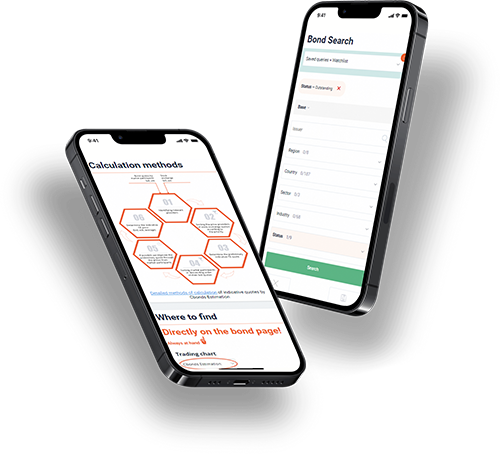
full data on over 1 000 000 bonds, 100 000 stocks, 100 000 indices, 17 000 ETF and 150 000 Mutual Funds; powerful bond screener; over 350 pricing sources among stock exchanges & OTC market; ratings & financial reports; user-friendly interface; available anywhere via Website, Excel Add-in and Mobile app.
Register


 Bond Screener
Armada Hoffler Properties, Q3 2026 Earnings Call Transcript
AH Realty Trust’s transformation into a focused retail and mixed-use office REIT is substantially complete: most multifamily assets have been sold, non-core financing and construction businesses exited, and debt reduced. Management raised 2026 adjusted FFO guidance to $0.57–$0.59 per share after third-quarter same-store cash NOI grew 6.1%. Retail and office NOI guidance is 2.5%–3.5% and 3%–4%, respectively. Leverage was 7.1x at quarter-end; remaining dispositions are expected to bring it to the 5.5x–6.5x target range. Refinancings address material maturities through 2028, with none expected until 2029, and management expects debt to be fully fixed or hedged after remaining sales close.
Leasing remains strong, with retail 95% leased and office nearly 97% leased. Management sees rent-growth potential from limited new supply, lease mark-to-market opportunities and signed leases not yet contributing rent, supporting organic growth into 2027. It expects most of the gap between leased and economic occupancy to close by mid-2027, while emphasizing disciplined, selective capital allocation. Fourth-quarter same-store growth is expected to moderate; retail bad-debt caution and a strong prior-year comparison are among the cited factors.