










Explore the most comprehensive database
1 000 000
bonds
100 000
stocks
175 910
ETF & Funds
100 000
indices
Track your portfolio in the most efficient way

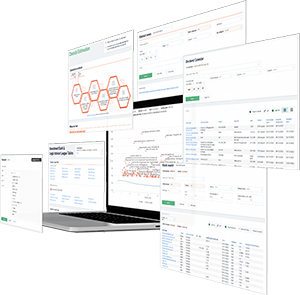

full data on over 1 000 000 bonds, 100 000 stocks, 100 000 indices, 17 000 ETF and 150 000 Mutual Funds; powerful bond screener; over 350 pricing sources among stock exchanges & OTC market; ratings & financial reports; user-friendly interface; available anywhere via Website, Excel Add-in and Mobile app.
Register


 Bond Screener
Hudson Pacific Properties Inc, Q3 2026 Earnings Call Transcript
Hudson Pacific Properties reported a fifth consecutive quarter of rising office occupancy, stronger studio performance and 8.3% growth in same-store cash NOI, prompting an increase in its 2026 core FFO outlook to $1.15–$1.21 per share. Leasing demand remains firm, with a 2.1 million-square-foot pipeline and more than 1 million square feet in advanced negotiations; management expects the pipeline to support growth into 2027. West Coast office markets are recovering, led by the Bay Area and Seattle, while Los Angeles remains mixed. Tech-stock volatility has not yet affected tours or leasing activity, though the company is monitoring its effect on private funding. Studio conditions diverge: New York production is rising, while Los Angeles remains below historical levels; proposed federal and California tax incentives could support a rebound.
Asset sales and a $200 million senior-note repurchase reduced the company’s share of debt by 14% year over year, with pro forma liquidity of $840 million. Management expects leverage to trend lower and same-store cash NOI to continue improving as leases commence and free rent burns off; AFFO is expected to turn positive in the second half of 2027. Debt maturities will be addressed through a combination of liquidity, asset sales and capital markets, with no equity raise planned at current levels.