










Explore the most comprehensive database
1 000 000
bonds
100 000
stocks
175 910
ETF & Funds
100 000
indices
Track your portfolio in the most efficient way

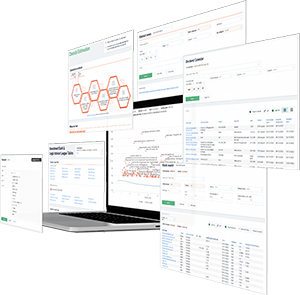

full data on over 1 000 000 bonds, 100 000 stocks, 100 000 indices, 17 000 ETF and 150 000 Mutual Funds; powerful bond screener; over 350 pricing sources among stock exchanges & OTC market; ratings & financial reports; user-friendly interface; available anywhere via Website, Excel Add-in and Mobile app.
Register


 Bond Screener
Eos Energy Enterprises, Q3 2026 Earnings Call Transcript
Eos Energy reported record Q3 revenue of $82.7 million and its eighth consecutive quarter of gross-margin improvement, supported by higher shipments, lower production costs and stronger factory productivity. The company is consolidating manufacturing at Thorn Hill, where output per shift is higher, and expects another 19–24 percentage-point improvement in adjusted gross margin in Q4. It reaffirmed 2026 revenue guidance of $300–325 million and expects capital spending to moderate as major facility investments near completion; management expects cash performance to improve alongside EBITDA, while noting that quarterly cash use will depend on production, working capital and customer payment timing.
Backlog fell sequentially to $765 million as shipments exceeded new bookings, which management attributed to project timing rather than a change in demand. Eos cited 3.5 GWh of late-stage opportunities, many awaiting financing, and growing demand for long-duration storage and systems that can both buffer rapid load swings and shift energy over hours. Key challenges include converting opportunities into orders and improving field reliability; management said it is continuing DawnOS upgrades and targeting more consistent system performance.