










Explore the most comprehensive database
1 000 000
bonds
100 000
stocks
175 910
ETF & Funds
100 000
indices
Track your portfolio in the most efficient way

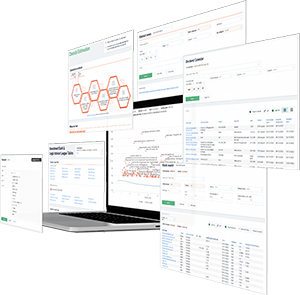
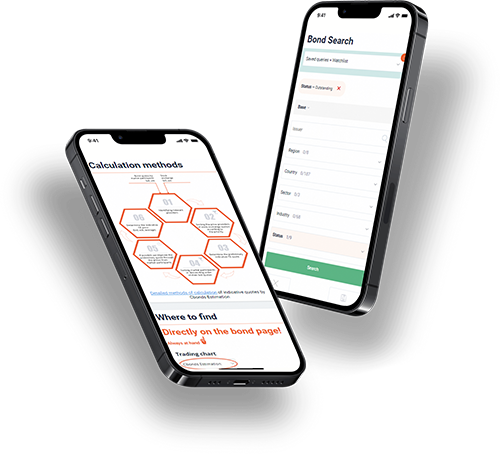
full data on over 1 000 000 bonds, 100 000 stocks, 100 000 indices, 17 000 ETF and 150 000 Mutual Funds; powerful bond screener; over 350 pricing sources among stock exchanges & OTC market; ratings & financial reports; user-friendly interface; available anywhere via Website, Excel Add-in and Mobile app.
Register


 Bond Screener
Delek US Holdings, Q3 2026 Earnings Call Transcript
Delek US reported strong third-quarter results, supported by stronger refining margins, higher capture rates and operational reliability across all four refineries. Management raised its annualized Enterprise Optimization Plan target to at least $250 million and expects the program to keep improving free cash flow. The company expects about $425 million of proceeds from 2025 small-refinery exemptions in Q4, while maintaining compliance with its renewable-fuel obligations. Management sees supportive distillate and jet-fuel markets, citing low inventories and elevated freight costs, and expects refining operations to benefit from strong crack spreads.
Delek has improved its standalone balance sheet to a net-cash position and plans to raise its quarterly dividend by about 18% and spend roughly $100 million on share buybacks in Q4. Executives expect mid-cycle free cash flow of $700–800 million and say they do not intend to hold excess cash, while emphasizing disciplined capital allocation through the cycle. Delek Logistics raised its 2026 EBITDA guidance to $530–560 million and expects further growth from organic projects in 2027; reducing Delek’s ownership and progressing toward deconsolidation remain part of the strategy.