Net debt is an absolute indicator used in financial analysis to measure a company’s financial stability and liquidity.
The net debt ratio is calculated by subtracting the company’s cash and cash equivalents from its total debt. It reflects how much debt the company will have if it uses all the cash it has to pay off current debt.
Total debt is the sum of the long-term and short-term debt of the company, which includes credits (loans), financial lease obligations (leasing), debt securities issued, derivative financial instruments, as well as debt to pay dividends.
Cash and cash equivalents include cash on hand, demand deposits, and highly liquid securities. The indicator value is specified as part of the assets in the organization’s statement of financial position (balance sheet).
For example,
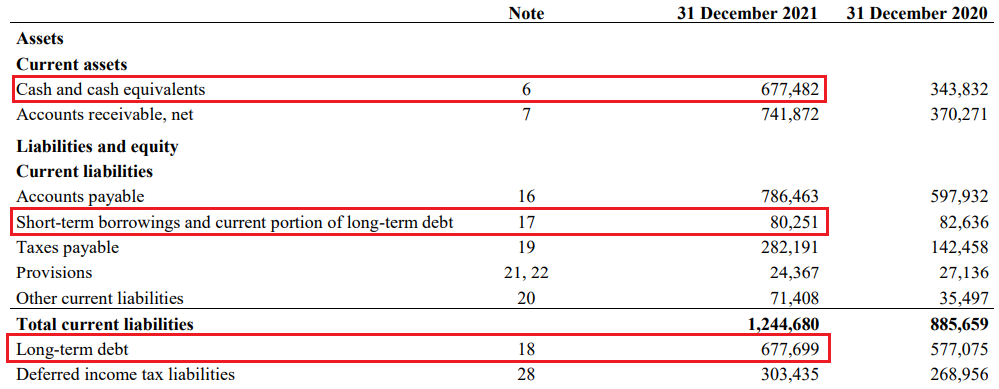
Lukoil’s net debt, according to 2021 financial statements drawn up in accordance with IFRS, is 80,468 million rubles. (80,251 million rubles + 677,699 million rubles - 677,482 million rubles)

Unlike total debt, net debt is a more objective indicator of the debt ratio because a company may have a certain amount of cash to fully or partially repay its creditors.
The net debt ratio can be positive or negative. However, a negative value indicates that the company has an excess of highly liquid assets, which points to inefficiency in using available cash.
Net debt can be used to calculate various kinds of financial indicators, for example, net debt /
EBITDA, Net Debt / Free cash flow, as well as the value of the company (Enterprise Value), which is defined as the sum of its market capitalization, net debt, and the minority share, that is the share of minority shareholders that does not give them control over the activities of the organization.
Bond Screener
Watchlist
Excel Add-in
API


