By Maksim Zenkov, Head of Indian Fixed Income Market of Cbonds
Updated March 31, 2024
What are Inverse Floaters?
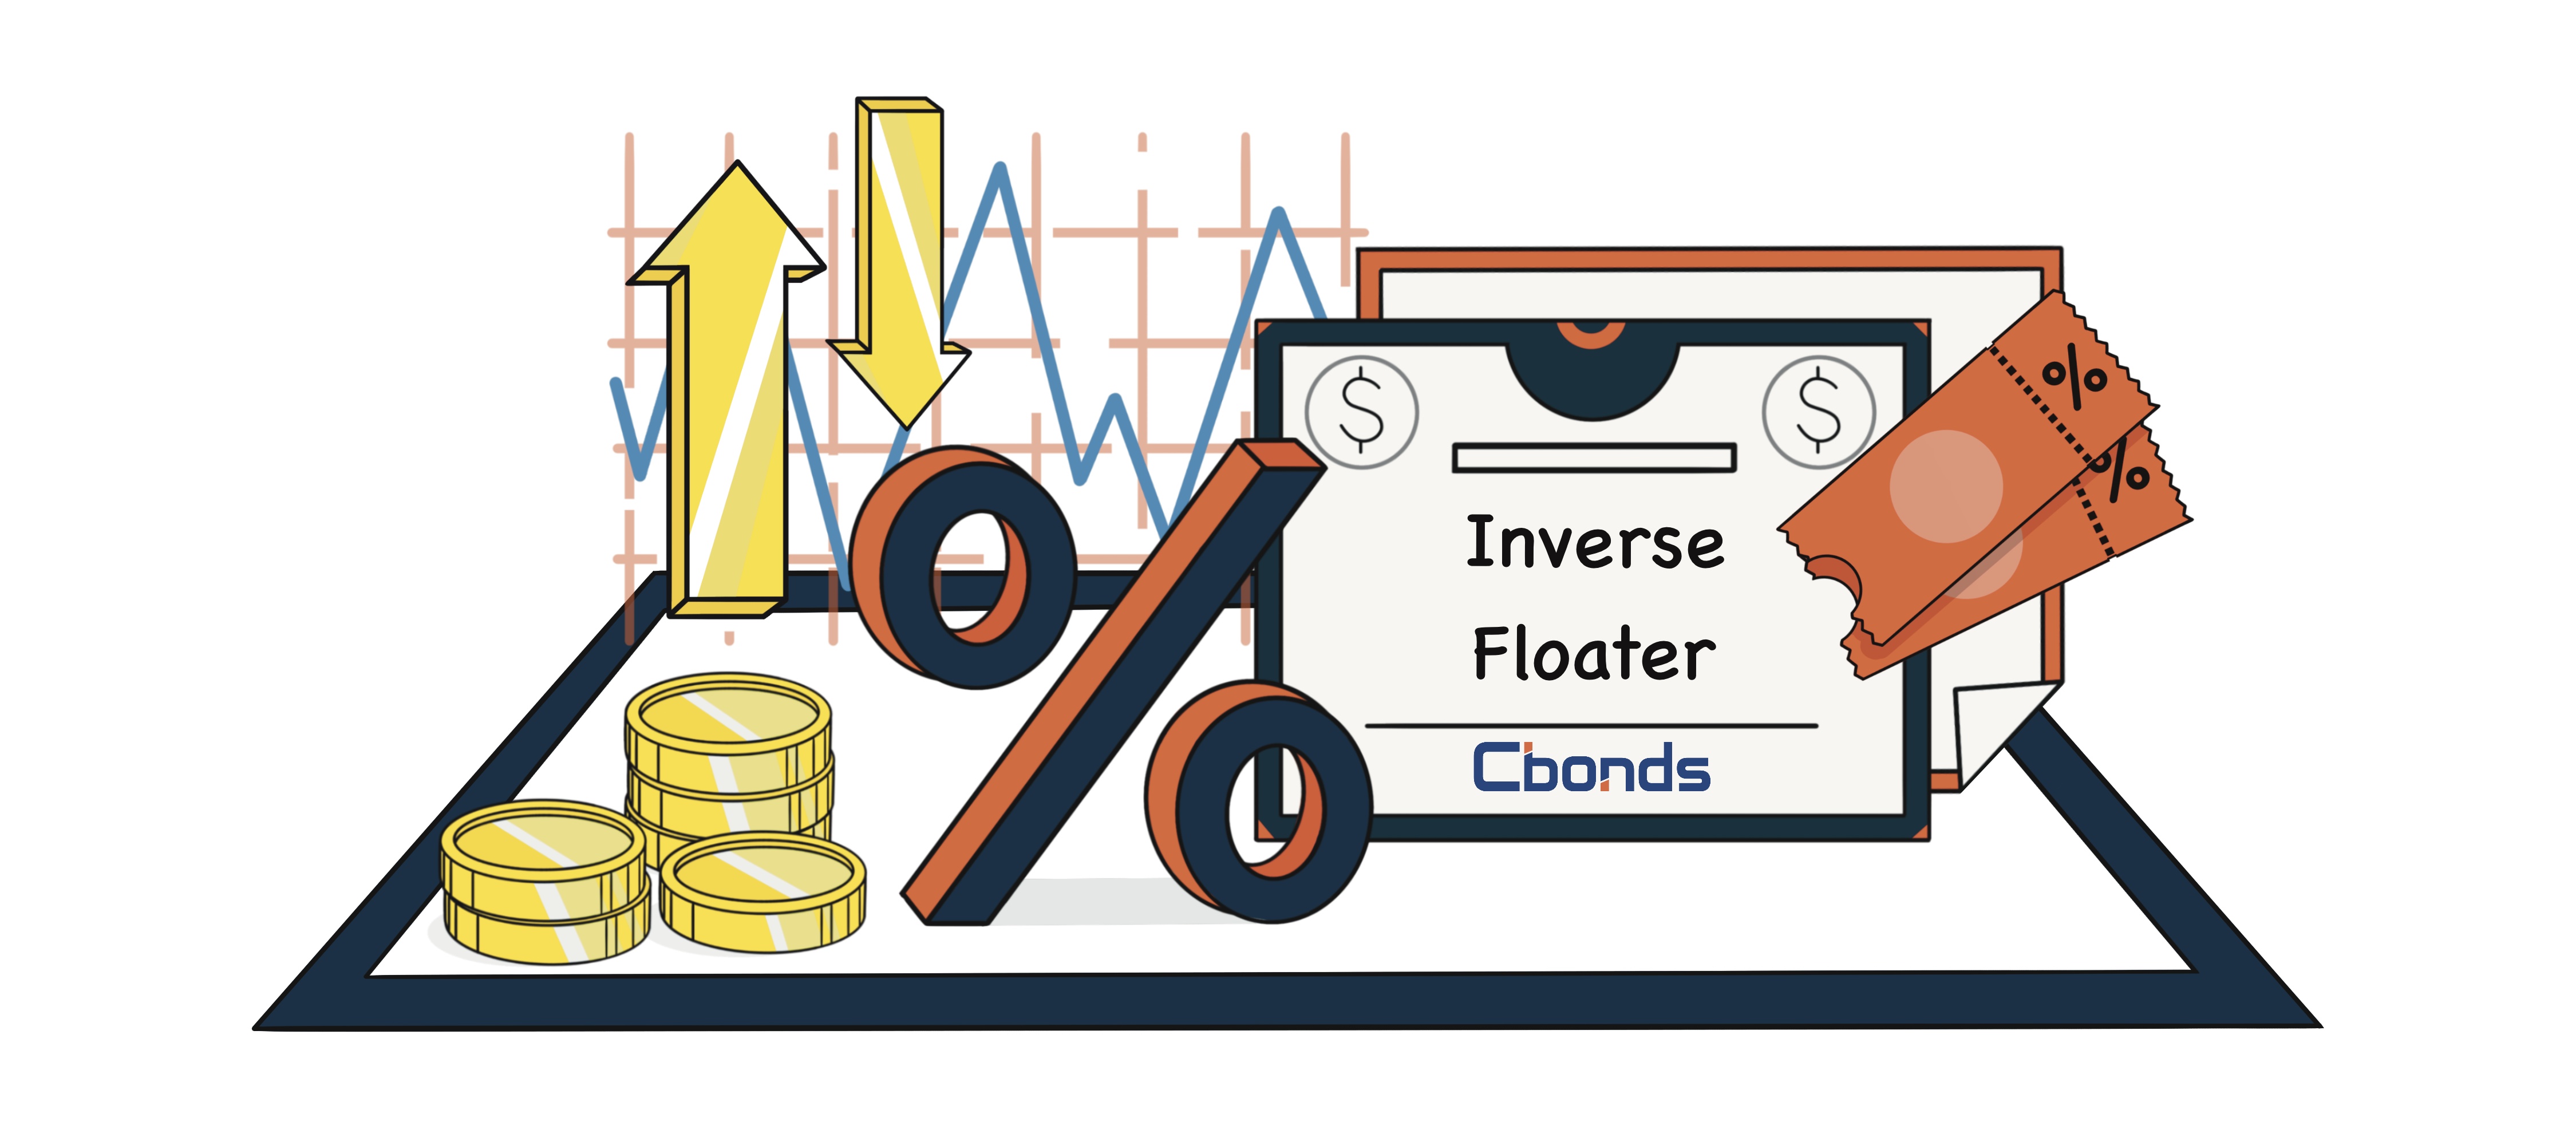
Inverse floaters are debt instruments with a unique coupon rate structure. Unlike traditional bonds, their coupon payments move inversely to changes in benchmark interest rates. As interest rates rise, the coupon payments on inverse floaters decrease, and vice versa. While they present potential benefits for investors, such as outperforming in declining rates scenarios, inverse floaters also come with heightened interest rate risk, making them a specialized and potentially volatile investment option.
How Does Inverse Floaters Work?
Inverse floaters operate conversely to traditional bonds by adjusting their coupon payments in response to changes in benchmark interest rates. When the prevailing interest rates increase, the coupon payments on inverse floaters decrease, and accordingly, when rates decrease, the coupon payments rise. In other words, these instruments provide investors with periodic interest payments that move in the opposite direction to the broader interest rate trends.

Features
Benefits
-
Inverse Relationship with Interest Rates. For issuers, inverse floaters provide a hedge against rising interest rates. As rates increase, the coupon payments on these instruments decrease, relieving the debt servicing burden.
-
Outperformance in Falling Rate Environments. In declining rate scenarios, investors will benefit from the inverse floaters as under such conditions these securities outperform other fixed-income products.
-
Strategic Portfolio Diversification. Adding inverse floaters to a diversified portfolio can enhance risk management. Their unique interest rate sensitivity offers a counterbalance to traditional bond investments, contributing to a more resilient and adaptive investment strategy.
-
Flexibility in Interest Rate Expectations. Investors’ response to the issues of inverse floaters reflects specific views on future interest rate movements. The inherent flexibility allows for strategic positioning based on expectations for changing economic conditions.
Risks
-
Heightened Interest Rate Risk. Inverse floaters are particularly sensitive to changes in interest rates. When rates are rising, yields on these instruments decline, impacting the market price and potentially resulting in lower-than-expected returns for investors. Conversely, a decline in the prevailing rates can negatively impact the issuer’s debt servicing position.
-
Increased Volatility and Price Fluctuations. Due to their inverse relationship with interest rates, inverse floaters can experience significant price fluctuations and heightened volatility. This can pose challenges for investors looking for stable and predictable returns.
-
Complexity and Lack of Transparency. The structure of inverse floaters can be complex, involving calculations based on reference rates and coupon leverage. This complexity may make it challenging for some investors to fully understand and assess the risks involved.
-
Credit and Issuer Risk. As with any fixed-income instrument, there is a risk associated with the creditworthiness of the issuer. Investors should carefully evaluate the credit risk profile of the entity issuing the inverse floaters.
Coupon Rate Calculation
The coupon rate of an inverse floater is determined by subtracting the reference interest rate from a constant on each coupon date. The formula for the coupon rate can be expressed as follows: Coupon rate = Constant (fixed rate) − (Coupon leverage × Reference rate) Here, the coupon leverage represents the multiple by which the coupon rate changes for a 100 basis point (bps) change in the reference rate. The Constant (fixed rate) is the maximum rate the floater can yield. For example, an inverse floater can pay interest quarterly with a coupon rate calculated using a formula: 7% − 2 × 3-month LIBOR. In this example, as the LIBOR increases, the bond’s coupon rate decreases. To prevent the coupon rate from falling below zero in the event of a substantial increase in the reference rate, a floor rate is often set. This floor acts as a minimum limit for coupon rate after adjustment and is typically set at zero. The general formula for the coupon rate of an inverse floater is essential for investors to grasp, providing insights into how changes in the reference rate affect the performance of the instrument.
Inverse Floaters vs. Inverse Floating-Rate Notes
-
Coupon Rate Dynamics. The coupon rate of inverse floaters moves inversely to changes in benchmark interest rates. As rates rise, coupon payments decrease, and vice versa. Coupon payments on floating-rate notes are positively related to the changes in the reference rate. When interest rates rise, the coupon payments increase.
-
Risk Profiles. Inverse floaters introduce a higher degree of interest rate risk for an investor, especially in rising rates environments. Market price and yield can be impacted significantly. Floating-rate notes tend to have lower interest rate risk as they move in the same direction as the overall market does.
-
Market Performance. Inverse floaters may outperform other instruments in declining rates scenarios, providing potential benefits to investors anticipating a decrease in interest rates. Floating-rate notes offer more stability and income potential, particularly in rising rates environments.
-
Investment Strategy Considerations. Inverse floaters are suited for investors anticipating a decrease in interest rates or seeking hedging opportunities. Floating-rate notes are attractive for those expecting interest rates to rise, offering a way to capture higher coupon payments in such environments. Both types of securities require careful monitoring of interest rate trends.
Bond Screener
Watchlist
Excel Add-in
API


